Acoustic Conformance Xaminer® (ACXTM) Service
IDENTIFIES AND CHARACTERIZES LEAKS AND FLOW AROUND THE WELLBORE AND BEHIND PIPE
Halliburton has a new-generation acoustic analysis tool that uses hydrophone array technology to locate and describe communication paths and flow areas—vertically and radially in the wellbore area
in real time. The array triangulates on the sound/flow source in or around the wellbore. Array analysis also helps eliminate false picks off of frequency and magnitude shows that have more to do with the well structure than the leak source. The radial locator has proven invaluable in some wells that have been logged by identifying which annulus or component of a completions system is leaking.
The ACX™ service also reduces time by providing a continuous mode to quickly identify areas with possible leaks in the wellbore. In addition, it can accomplish stationary measurements to refine and reaffirm areas where leaks are identified by monitoring activity.
Through post-run data analysis, the ACX service can provide the flow rate and phase estimations at the location of areas with possible leaks. In controlled testing, flow rates as low as 0.01 gpm have been identified. Field examples have also identified very low flow rates, which have been verified by customers.
ACOUSTIC CONFORMANCE XAMINER® SERVICE
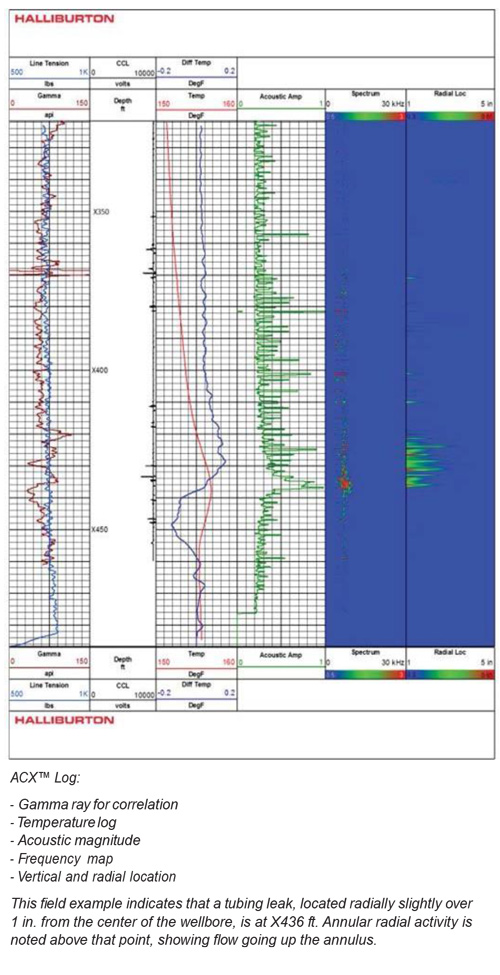
The ACX service provides the following information:
» Real-time data
Vertical location
Radial location
Frequency map
Acoustic magnitude
» Post-Processing reports
Flow rate degree
Phase type (liquid-gas)
Flow mapping
Advanced Processing
During the real-time capture, the surface data received enables quick on-site results. The ACX™ tool additionally stores high-definition data internally that can be downloaded at surface and sent to the Formation & Reservoir Solutions group for advanced high-definition processing.
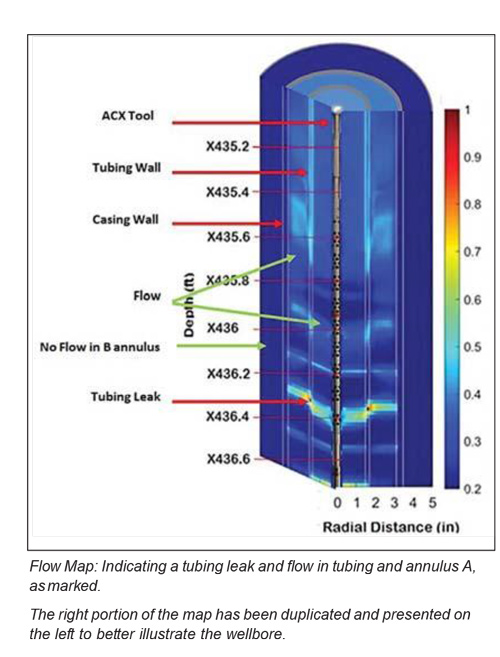
This data permits a closer examination of the flow and acoustic events around the wellbore. Flow mapping analysis can also be done with the data to create a map of the acoustic activity and present it in a 2D image that will show the flow path in the well.
The image to the right is a flow map that has been generated from the field log previously shown. The image illustrates a cross section of the wellbore with the tool in the middle. So as marked, the flow can be seen going through the tubing wall (Tubing Leak). Flow can be seen in the tubing and in annulus A (Flow), distinguished by the white mist coloring, while annulus B is dark blue indicating no flow observed (No Flow).
Cased-Hole Diagnostic Services
The ACX service was designed to be a part of a full suite of diagnostic services. It is combinable with production logging instruments, cement evaluation instruments, and much more.