Open Hole
Xaminer® Multicomponent Induction (MCI) Service
MEASURES FORMATION RESISTIVITY IN THREE DIMENSIONS
OVERVIEW
The Halliburton Xaminer® Multicomponent Induction (MCI) service enables the evaluation of anisotropic formations by measuring the formation resistivity both vertically and horizontally at different depths of investigation. When run with a directional instrument, the tool provides structural dip and azimuth.
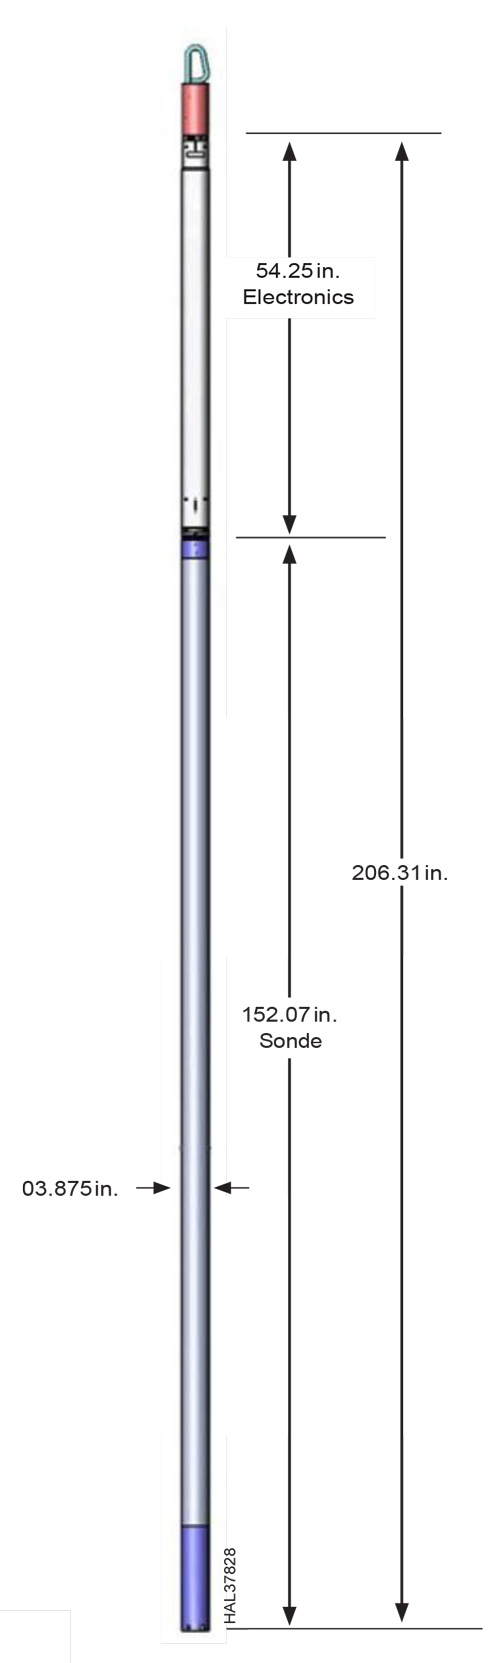
The Xaminer tool has a transmitter triad (collocated triaxial array of coils) and six sets of receiver coils. The two receiver coils closest to the
transmitter are standard induction coils, while the remaining four coils are built as triads. The tool operates by sequentially energizing each of the coils (x, y, z) in the transmitter and measuring the signals in each of the receiver coils. Therefore, each of the receiver triads produces nine signals per frequency. These signals are corrected for borehole effects and then inverted in real time to obtain the desired formation measurements.
The tool operates simultaneously as an array induction with the same output as the Halliburton ACRt™ (Array Compensated Resistivity tool), and as an Rh and Rv tool. It is combinable with tools from the LOGIQ® family, and it should be run centralized, at the bottom of the string.
Because the tool provides dip and azimuth information, it needs to be run with tools that have a directional package.
BENEFITS
» Provides more accurate evaluation of water saturation in anisotropic formations, including turbidites, laminated formations, low-resistivity pay, and fractures
» Provides more accurate resistivity in angled beds
» Rv and Rh are generated in real time
» Structural dip and azimuth
APPLICATIONS
More accurate evaluation of water saturation in anisotropic formations, as in:
» Turbidities
» Laminated formations
» Low-resistivity pay
» Structural information: formation dip and azimuth in oil-based muds
» Invasion analysis using 3D resistivity data
» Fractures

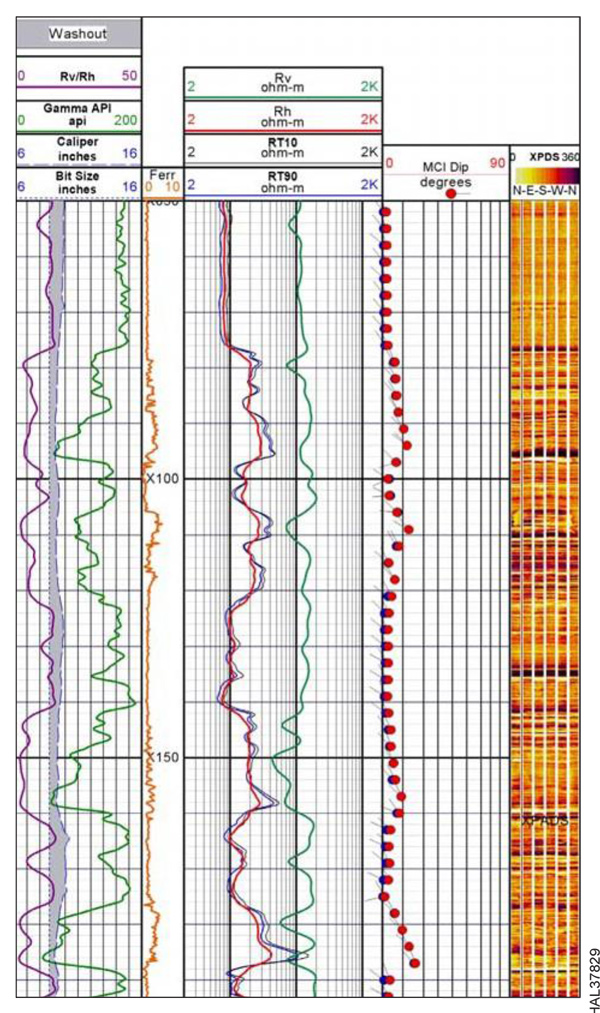
Xaminer MCI log of a very laminar section of a test well in Ft. Worth, Texas. The entire section is laminated, as seen on the image log of track
- In track 3, it can be observed that the horizontal resistivity follows the trend of the ACRt™ logs (RT90, RT10), but with lower vertical resolution. The Rv is higher than Rh due to the effect of the laminations. Track 4 shows the dip/dip-azimuth obtained by the MCI tool, which correlates with results from the resistivity image. In track 2 (depth track), the Ferr curve shows the quality of the inversion, and track 1 shows not only GR and caliper, but Rv/Rh.